Efficienza energetica
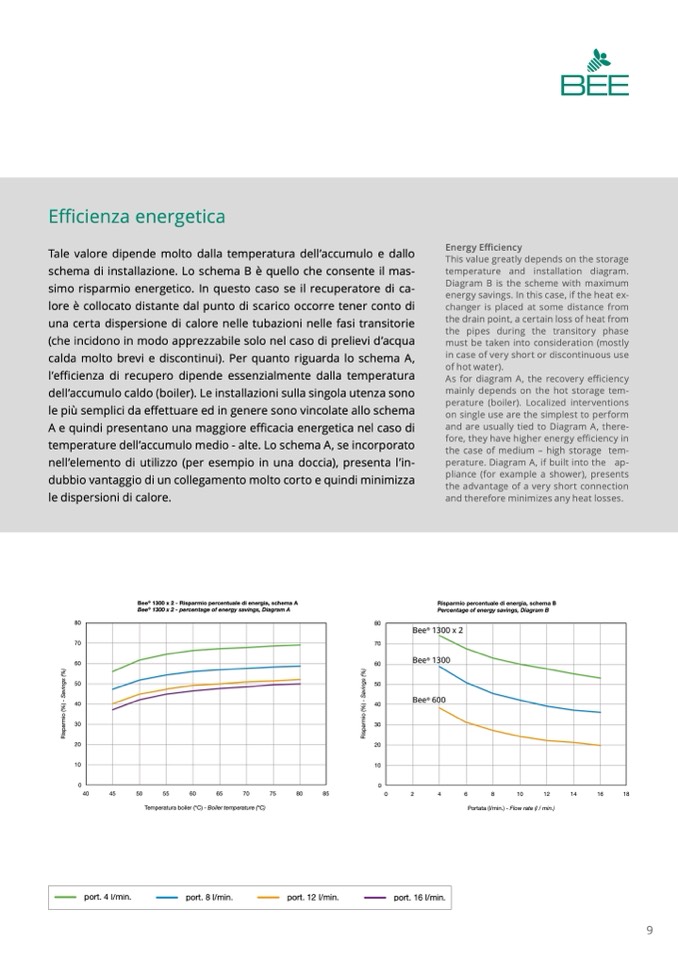
Tale valore dipende molto dalla temperatura dell’accumulo e dallo
schema di installazione. Lo schema B è quello che consente il mas-
Energy Efficiency
This value greatly depends on the storage
temperature and installation diagram.
Diagram B is the scheme with maximum
energy savings. In this case, if the heat ex-
changer is placed at some distance from
the drain point, a certain loss of heat from
the pipes during the transitory phase
must be taken into consideration (mostly
in case of very short or discontinuous use
®
Bee
of
13
h
00
o
x
t
2
w
- R
a
is
t
p
e
a
r
m
).
io percentuale di energia, schema A
simo risparmio energetico. In questo caso se il recuperatore di ca-
®
Bee 600 - Risparmio percentuale di energia, schema A
Bee
®
600 - percentage of energy savings, Diagram A
lore è collocato distante dal punto di scarico occorre tener conto di
Risparmio percentuale di energia, schema A
percentage of energy savings, Diagram A
energia, sch
u
em
na
A
certa dispersione di calore nelle tubazioni nelle fasi transitorie
ings, Diagram A
(che incidono in modo apprezzabile solo nel caso di prelievi d’acqua
calda molto brevi e discontinui). Per quanto riguarda lo schema A,
l’efficienza di recupero dipende essenzialmente dalla temperatura
dell’accumulo caldo (boiler). Le installazioni sulla singola utenza sono
le più semplici da effettuare ed in genere sono vincolate allo schema
0
A e quindi presentano una maggiore efficacia energetica nel
6
caso di
temperature dell’accumulo medio - alte. Lo schema A, se incorporato
nell’elemento di utilizzo (per esempio in una doccia), presenta l’in-
40
dubbio vantaggio di un collegamento molto corto e quindi minimizza
Bee 1300 x 2 - percentage of energy savings, Diagram A
le dispersioni di calore.
30
port. 4 l/min. and therefore minimizes any heat losses.
port. 4 l/min.
20
port. 8 l/min.
10
port. 4
port. 8
port. 1
80
70
50
As for diagram A, the recovery efficiency
mainly depends on the hot storage tem-
perature (boiler). Localized interventions
on single use are the simplest to perform
and are usually tied to Diagram A, there-
fore, they have higher energy efficiency in
the case of medium – high storage tem-
perature. Diagram A, if built into the ap-
pliance (for example a shower), presents
the advantage of a very short connection
®
port. 4 l/min.
port. 8 l/min.
port. 12 l/min.
port. 8 l/min.
port. 12 l/min.
port. 16 l/min.
45
50
55
60
65
70
75
80
85
0
port. 16 l/min.
40
45
50
55
60
65
70
75
80
85
Temperatura boiler (°C) - Boiler temperature (°C)
port. 1
port. 12 l/min.
port. 16 l/min.
5
60
65
70
75
80
85
70
75
a
tura boiler (°C)
- Risparmio pe
80
70
60
50
40
30
port. 4 l/m
Risparmio percentuale di energia, schema B
Percentage of energy savings, Diagram B
1300 - Rispar mio pe rcentu
le di e nergia, schem aA
1300 -
ale di e
percen
nergia,
tage o
sche
f energ
aA
y savin gs, Dia gram
y savin gs, Di
gram A
Bee
®
1300 x 2
Bee
®
1300
Bee
®
600
in.
in.
min.
min.
perature (°C)
85
- percentage o
i energia, sche
vings, Diagram
Temperatura boiler (°C) - Boiler temperature (°C)
- Boiler temperature (°C)
80
Bee
®
a
Bee
®
A
rcent
u
m
f energ
a
ma A
70
60
A
50
40
30
20
10
0
80
70
Risparmio percentuale di energia, schema B
Percentage of energy savings, Diagram B
port. 4 l/min.
port. 4 l/min.
port. 8 l/min.
port. 4 l/min.
port. 8 l/min.
port. 12 l/min.
50
port. 8 l/min.
45
50
55
60
65
70
75
80
85
port. 16 l/min.
7
0
7
5
8
0
8
5
port. 16 l/min.
Bee
®
1300 x 2 - Risparmio percentuale di energia, schema A
80
85
Bee
®
1300 x 2 - percentage of energy savings, Diagram A
port. 12 l/min.
port. 12 l/min.
port. 16 l/min.
port. 16 l/min.
5
60
6
40
5
70
75
80
85
Temperatura boiler (°C) - Boiler temperature (°C)
9
port. 8 l/m
port. 120 l/
port. 16 l/
20
Bee
®
6
Bee
®
1
Bee
®
1
40
45
50
55
60
65
70
75
80
85
Temperatura boiler (°C) - Boiler temperature (°C)
0
0
2
4
6
8
10
12
14
16
18
Portata (l/min.) - Flow rate (l / min.)
60
port. 4 l/min.
port. 8 l/min.
port. 12 l/min.
port. 16 l/min.
v
m
d
a
a
t
u
r
a
b
o
i
l
e
r
(
°
C
)
-
B
o
i
l
e
r
t
e
m
p
e
r
a
t
u
r
e
(
°
C
)
3
0
port. 4 l/min.
port. 8 l/min.
port. 12 l/min.
2
6
r
m
i
o
(
%
)
-
S
a
v
i
n
g
s
(
%
)
R
i
s
p
a
r
m
i
o
(
%
)
-
S
a
v
i
n
g
s
(
%
)
R
i
s
p
a
r
m
i
o
(
%
)
-
S
a
v
i
n
g
s
(
%
)
R
i
s
p
a
r
m
i
o
(
%
)
-
S
a
v
i
n
g
s
(
%
)

